Polynomial Approximation and Interpolation
Suppose the scatterplot of the data
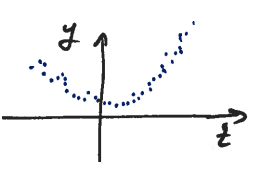
We can fit a line to the data, but it does not really make sense. A parabola
The
Consider a special case:
(# measurements = # coefficients) is square and, if is nonsingular, we can find such that . In other words, we can solve exactly, i.e. find a polynomial that fits the data exactly. This polynomial is called interpolating polynomial.
Lemma: If
Remark: Textbook gives a proof based on an LU decomposition. But the statement is very intuitive if you think about it geometrically.